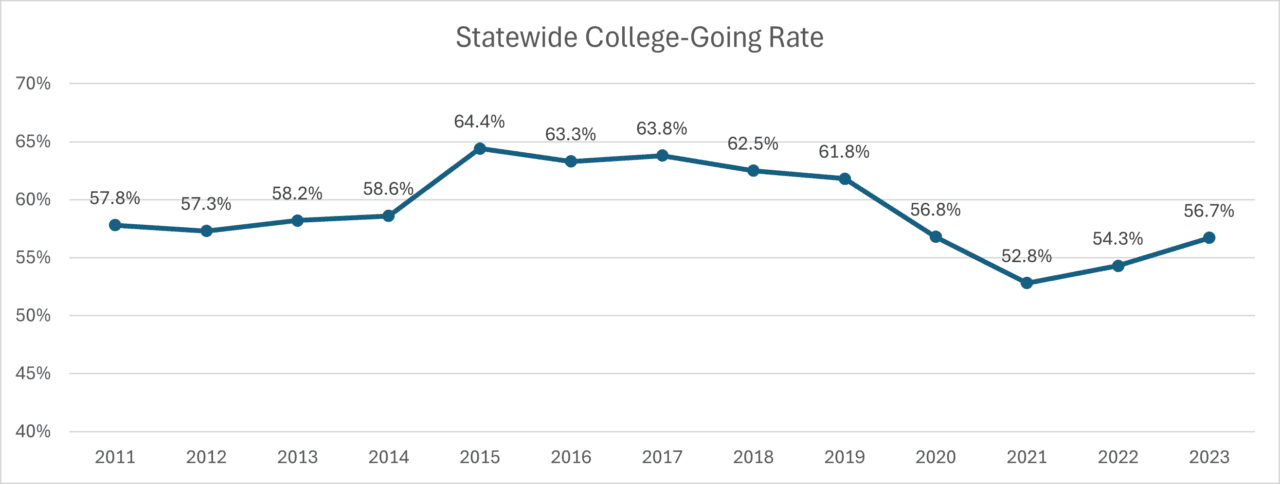
1. For the second year in a row, the statewide college-going rate has increased, but still falls five percentage points below pre-pandemic levels.
For the second year in a row, Tennessee saw an increase in its college-going rate (CGR), which is the percentage of high school graduates who seamlessly enroll in any postsecondary institution after high school graduation. The 2.4 percentage point increase to 56.7% is the largest one-year increase since the introduction of the Tennessee Promise Scholarship in 2015. The scholarship covers any remaining tuition and fees after other financial aid is applied for Tennessee residents attending a Tennessee community college, college of applied technology, or another eligible institution offering an associate degree.
This increasing college-going rate is in line with Momentum Year 2023, an initiative spearheaded by the Tennessee Higher Education Commission, which had a central goal to increase college enrollment to 60% for the high school graduating class of 2023. Efforts to achieve this included improved advising programs, strategic partnerships, and increased FAFSA completion rates. Though the class of 2023 saw a significant CGR increase, their rate fell short of the initiative’s 60% goal by 3.3 percentage points. Two years after the bulk of pandemic impacts on the CGR, Tennessee must still increase an additional five percentage points to recover the nine percentage point loss.

2. For the first time, college-going by economic status was unveiled in this year’s report, and revealed that less than 40% of Economically Disadvantaged students enrolled in college immediately after high school.
Economically disadvantaged (ED) students include those who are in foster care, homeless, migrant students, runaway students, and/or who participate in federal/state income/nutrition programs. The gap in college-going rate between ED and non-ED students was 26 percentage points–substantially larger than the 2023 Latino-white CGR gap and nearly double the size of the 2023 Black-white CGR gap. At the height of the pandemic (2020 and 2021), the difference in the college-going rate between ED and non-ED students was 28.2 percentage points. The 26 percentage point gap in 2023 represents a near-return to its pre-pandemic size of 25.6 percentage points. Going forward, it will be crucial for policymakers and education leaders to identify, fund, and implement strategies that close this gap.

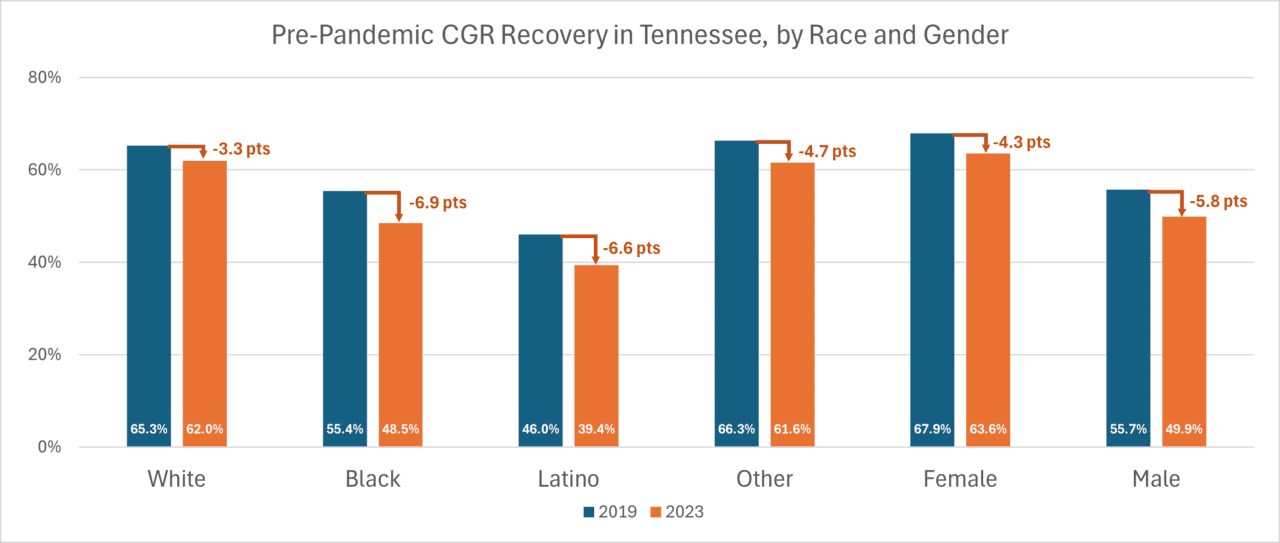
3. Black, Latino, and Male students’ college-going rate is recovering to pre-pandemic levels more slowly than white and female students’.
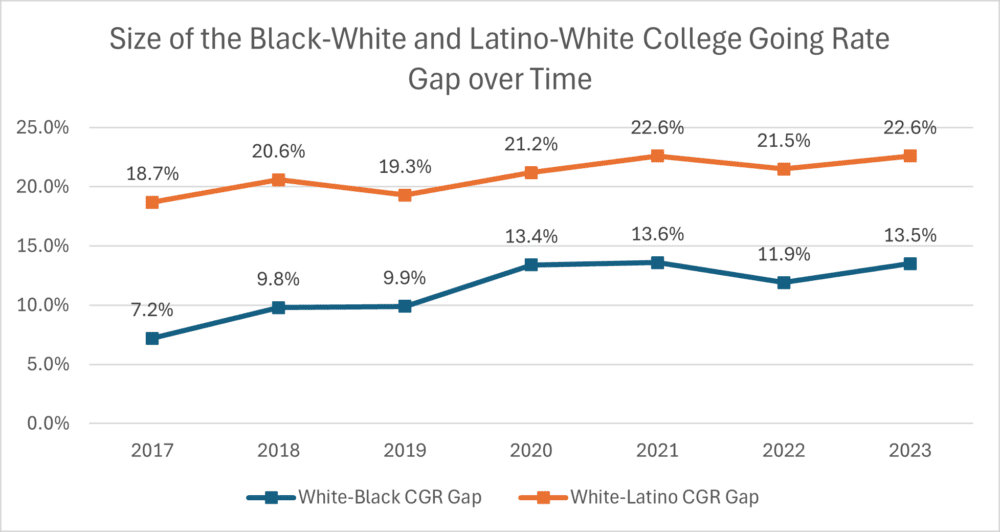
The pandemic disproportionately affected the college-going rate for Black and Latino students compared to their white peers. Black and Latino students are still farther from their respective pre-pandemic CGRs than white students are, resulting in widening CGR gaps. The pandemic-driven racial CGR gap increases peaked in 2021. Though those gaps narrowed slightly in 2022, they have once again returned to their 2021-peak sizes. For the class of 2023, there was a 13.4 percentage point disparity between Black and white students’ college-going (48.5% Black student CGR vs 62% white student CGR). Latino students’ college-going rate was 39.4%, resulting in a Latino-white gap of 22.6 percentage points.


The 2023 gap between male and female students was 13.7 percentage points, roughly the same size as the gap between Black and white students. Males enrolled in college at a rate of 49.9% while females enrolled at a rate of 63.6%. Black male and Latino male CGR increased more than males overall. Notably, Latino male student CGR increased 2.7 percentage points to 33.6%. This one-year growth is larger than for the state overall. However, even with this boost Latino males still had the lowest CGR of all race/gender pairs. White females experienced the largest one-year increase of all race-gender pairs. Their 4.7 percentage point increase resulted in a 69.5% CGR. Along with females in the ‘other’ race category, white females already had the highest CGR of any race/gender pair.
4. College Going Rates and recovery to pre-pandemic levels varies significantly between Tennessee counties.
Morgan*, Meigs*, and Lake** ⁺ counties had the lowest college-going rate of all Tennessee counties in 2023, each below 40%. Williamson, Lewis* ⁺, and Moore⁺ counties all stood out with the highest CGRs, each at or above 70%. Williamson County was the only county to surpass the 80% mark, with a CGR of 82.1%. Eighteen of Tennessee’s 95 counties met or exceeded their 2019 CGRs. Of note, Lewis* ⁺ and Hardin* counties each surpassed their 2019 CGRs by over 10 percentage points. Lake** ⁺, Morgan*, and Perry** ⁺ counties were the farthest below their pre-pandemic CGRs in 2023, by over 20 percentage points each.
Of Tennessee’s six largest counties (measured by the number of graduating high school students in the class of 2023), Knox was the only one to have surpassed their pre-pandemic college going rate. All of the six largest counties except Williamson (82.1%) and Knox (64.1%) had CGRs within the 50-56% range in 2023.

* at-risk: county is at risk for becoming distressed. There are 31 at-risk counties in Tennessee.
** distressed county: among the 10 percent most economically distressed counties in the nation. There are nine in Tennessee.
⁺ small county: a county with fewer than 100 graduates in the high school class of 2023. Smaller counties are likely to have large variance in their CGRs.
5. FAFSA filing increased for the class of 2023
In 2023, Tennessee doubled the 2022 number of high schools recognized as FAFSA Champions for either significantly increasing FAFSA filing rates or maintaining high filing rates. Promise Scholarship applicants that completed the FAFSA by the Promise deadline increased by 1.3 percentage points to 74.1%. This followed an outreach campaign to support over 3,000 school counselors and college access professionals with resources to better support students’ FAFSA completion.
More recently, updates intended to simplify the 2024-25 FAFSA application process resulted in significant delays and glitches that impacted the high school graduating class of 2024. This resulted in an 11% decrease in the number of high school seniors submitting FAFSA nationally. Though Tennessee experienced a similarly sized decrease, it still had the highest rate of FAFSA completions by the federal deadline in the country this year. Given the correlation between FAFSA completion and college enrollment, institutions of higher education (IHEs) are likely to see declines in their freshman class sizes. This has major implications for revenue streams for Tennessee’s IHEs. Though the federal FAFSA deadline for federal aid passed on June 30th, Tennessee has extended the deadline to submit the FAFSA for Promise eligibility until August 1st, 2024, which may blunt the impact for Tennessee students and eligible IHEs.
Equity Considerations
- For the first time, data is publicly available that reveals a 26 percentage point difference between the college-going rate of economically disadvantaged and non-economically disadvantaged students. What additional resources and supports would be the most impactful in increasing economically disadvantaged students’ CGR?
- The CGR data by economic status is not broken down by race or gender. How does CGR differ for Economically Disadvantaged Students who are Black, Latino, and white? Who are male and female?
- Black and Latino students’ 2023 college-going rate is slower to catch up to pre-pandemic levels than white students’. What unique roadblocks might be causing this delayed recovery for Black and Latino students?
Share This Story
